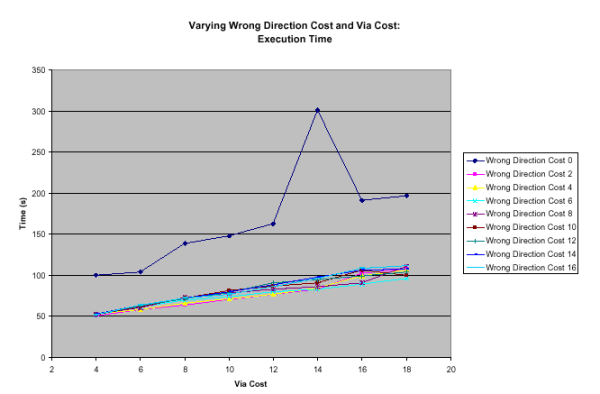
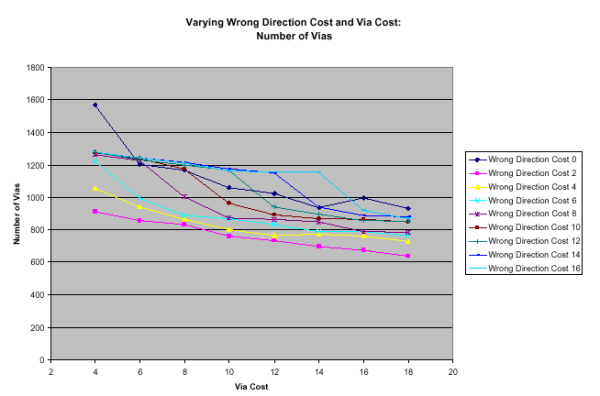
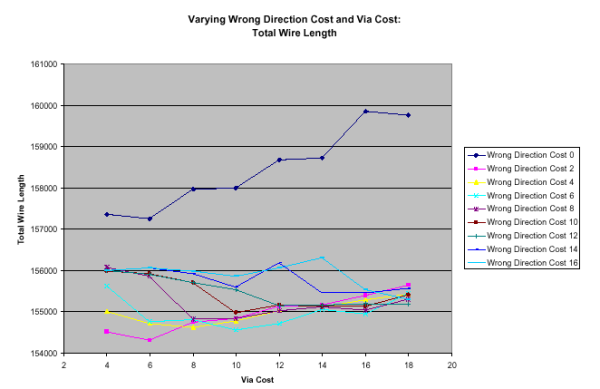
Several experiments were performed to explore the design space of routing options, specifically with regard to the constants used in the penalty function. The graphs below show several effects of varying wrong way costs and via costs.
|
|
|
This table details the results from several different benchmarks. The "Nets Routed" column displays the total number of two-point connections routed for that benchmark. The "Ave Expanded" column displays the total number of grid cells expanded per two-point connection. The "Time" coloumn displays the total execution time to derive a wiring solution. Finally, the "Violations" column displays the total number of violations in the wiring solution.
|
||||||||||||||||||||||||||||||||||||||||||||||||||||||||||||
|
Several experiments were performed to explore the design space of routing options, specifically with regard to the constants used in the penalty function. The graphs below show several effects of varying wrong way costs and via costs. |
|
|
|
|
|
|
|
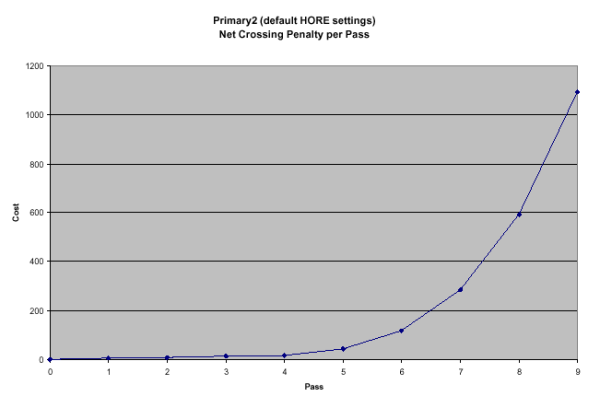
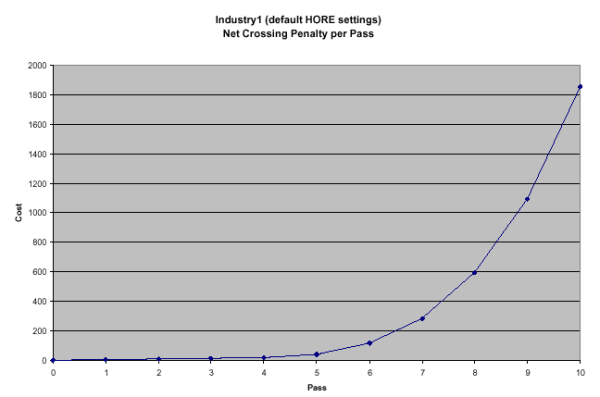
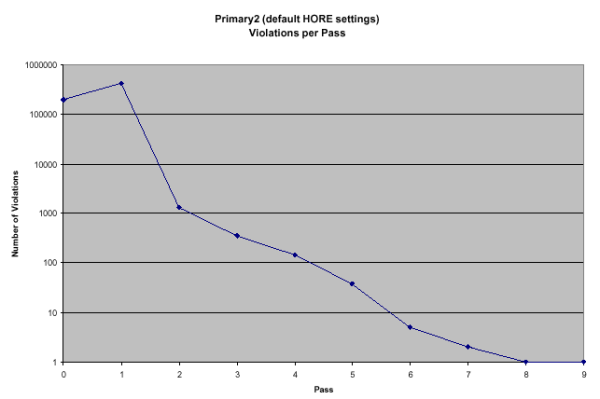
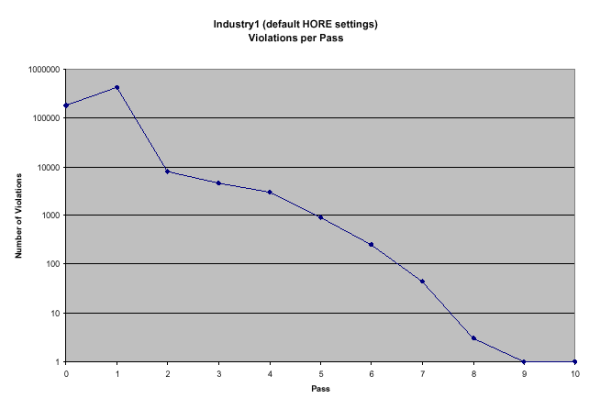
As HORE proceeds through ripup and reroute, the cost for crossing over other nets is increased. Shown below are graphs depicting the increase in cost through the passes of ripup and reroute. Unfortunately, or actually fortunately, no examples display the zig-zag cost function shape. This is because all examples were routed without needing to drop the cost (see Ralph Linsker's Trick #2). |
|
|
|
|